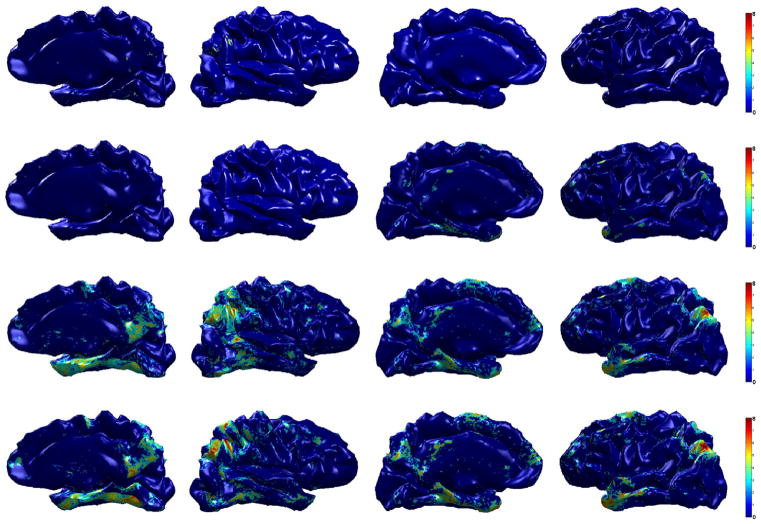
Fig. 10.
Group analysis result (AD vs. controls) on ADRC dataset. The resulting p-value (in − log10 scale) from hypothesis tests after FDR at q = 0.05 is shown on a template brain surface. First row: t-test on the raw cortical thickness data, Second row: t-test on the smoothed data, third row: Hotelling’s T2 test on WMD, fourth row: MGLM on WMD (without age and gender effect).

