
Fig. 13.
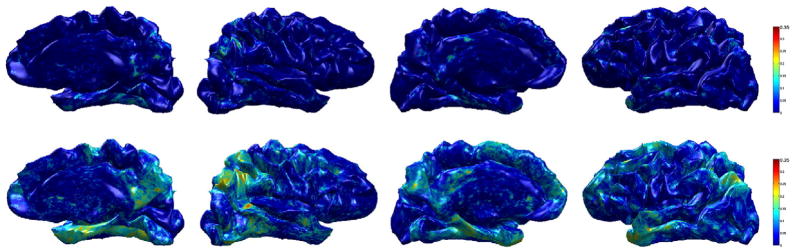
Sensitivity brain map using R2 (AD vs. CN) on ADRC dataset. Top row: R2 using raw cortical thickness, Bottom row: R2 using WMD. We can see that the model fits WMD better than cortical thickness, therefore WMD is more sensitive to the group difference than the raw cortical thickness.