Figure 5.

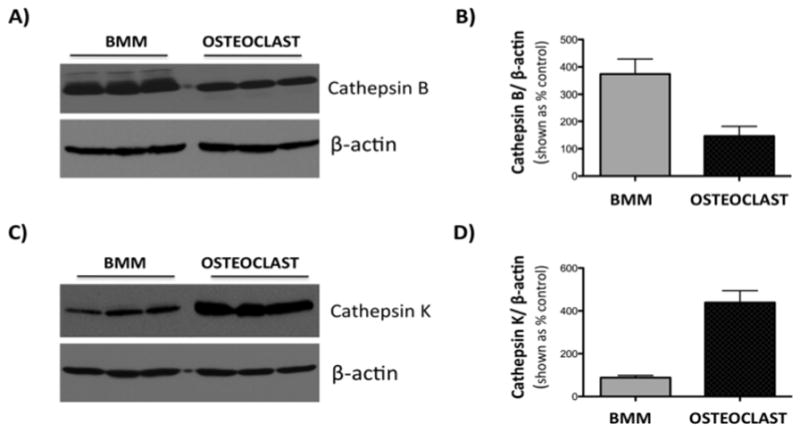
Expression of cathepsins B and K in BMM and BMM-derived osteoclast cells. Western blot analysis of expression of cathepsin B (A, top panel) and cathepsin K (C, top panel). Equal loading is shown by β-actin expression (A,C, bottom panels). Densitometric analysis of cathepsin B (B) and cathepsin K (D) bands was performed using Fuji Multimodal Imager and normalized to density of β-actin bands. Results are shown as a % density of actin bands +/− SD. Cathepsin K expression is several-fold higher in osteoclasts than in BMM cells.
