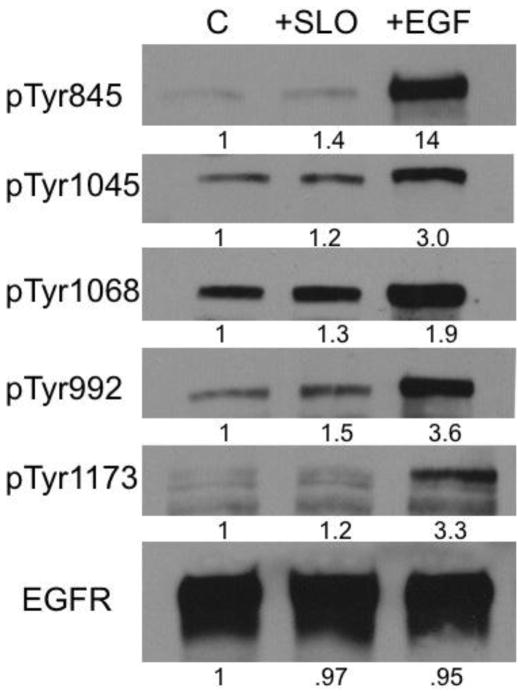
Figure 3.
Analysis of Tyr phosphorylation sites in EGFR in response to SLO or EGF. MDA MB 231 cells were treated with 10 IU/ml SLO, 50 ng/ml EGF or vehicle control for 1.5 h and analyzed by immunoblotting with phosphosite-specific antibodies and with anti-EGFR, as loading control, as described under Materials & Methods. Relative increases (shown as -fold increase vs. control) were determined by densitometry and the results were replicated in an independent experiment.

