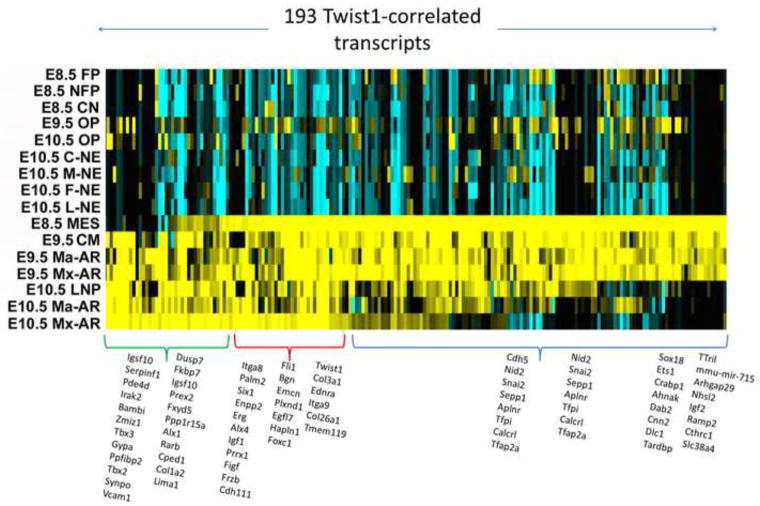
Figure 10. Heatmap of the top 193 genes whose expression correlates with Twist1 in the RNA-seq dataset.
Hierarchically clustered heatmap reveals three different patterns that correspond to genes with strongest expression in relevant samples from E8.5, E10.5, or both. The E8.5 cranial mesenchyme-prominent geneset is at the top (blue), and E10.5 maxillary arch-prominent set is at the bottom (green). Twist1 itself is strong in both, red group). In the heatmap, yellow indicates high expression and blue indicates low expression.

