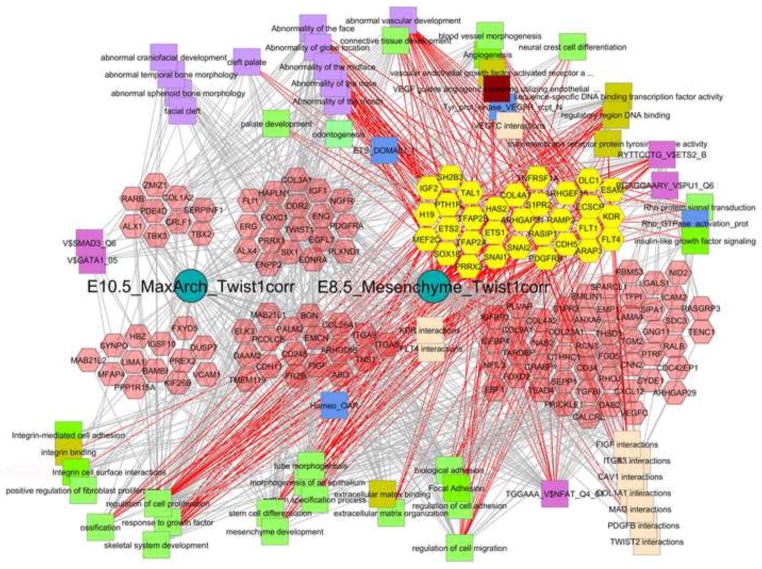
Fig. 11. Cytoscape-ToppCluster-based network analysis of genes that differentially co-express with Twist1 expression at E8.5, E10.5 or at both stages.
Twist1-correlated genes shown in Fig. 10 were divided into three clusters corresponding to expression in E8.5 cranial mesenchyme, E10.5 maxillary arch, or both. These three patterns are represented as the clusters of genes (hexagons) that are on the left (E10.5), center (E10.5+E8.5), or the right (E8.5). These three sets of genes are further divided into those previously associated with abnormal craniofacial or vascular development, shown above, and those not yet known to be associated with those phenotypes, shown below below (mouse phenotypes are lower case, human phenotypes are capitalized). Distinct classes of gene-associated properties are shown as different colored squares around the outside of the diagram. All E8.5-specific cranio/vascular functionally known genes are selected and appear as yellow hexagons, and the functions and properties that they are connected to are indicated by the red edges. The gray edges that go into those connected concepts or the concepts that have no red edges, are thus not linked to the core set of early genes. For example the facial bony abnormalities that are in the upper left are not connected to any of the E8.5 specific genes. Similarly, only 5 of the genes associated with integrin function are known to be craniofacial phenotype associated, but 9 additional genes are also associated with integrin signaling and function. This implicates a more significant role for integrin signaling and function in craniofacial mesenchyme development than might have been anticipated. The specific modules and connectivities of genes in these networks provide powerful suggestions about the gene interactions and overarching biological processes that drive craniofacial development. The importance of these additional gene function categories is suggested by the number known craniofacial connections that they have (red edges) or the number of unknown craniofacial genes that they are connected to (gray edges).

