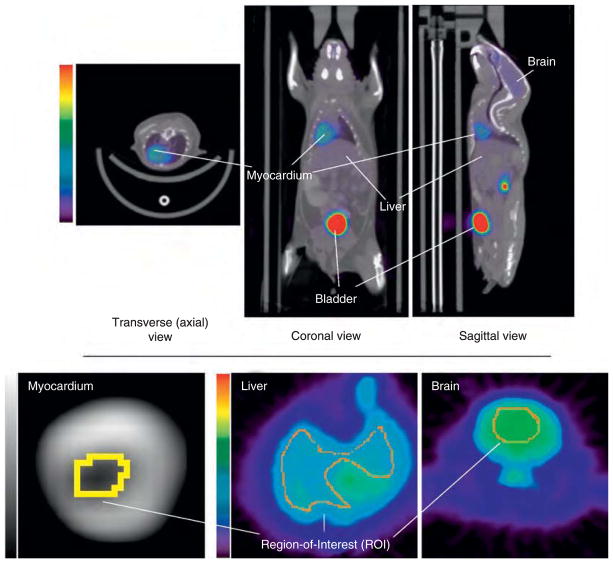
Figure 2.
Top: Sample image of [18F]FDG uptake in a mouse (m19796-fasted) coregistered to computed tomographipc images obtained from the Mouse Quantitation Program. Bottom: Regions of interest (ROIs) were drawn on axial slices around the blood-pool region of the left ventricle (≈ 1.6 mm in diameter), liver, and brain. The myocardium image in the bottom left corner r is magnified more than the others to better depict the ROI.

