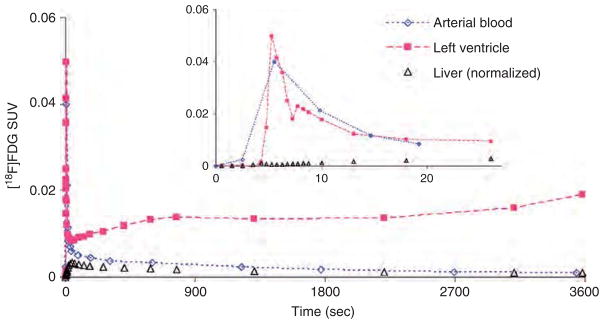
Figure 3.

Time-activity curves (TACs) of [18F]FDG concentraion in the arterial blood (time delay corrected), blood-pool region of the left ventricle (corrected for spillout effects using a recovery coefficient of 0.5) and liver (normalized to 60-minute blood sample) for m17385- normal (non-fasted) mouse from the Mouse Quantitation Program. Myocardial uptake is higher in the left ventricle TAC for non-fasted mice compared to fasted ones. The insert displays the same TACs during the first 30-second post-[18F]FDG injection. SUV = Standardized Uptake Value.
