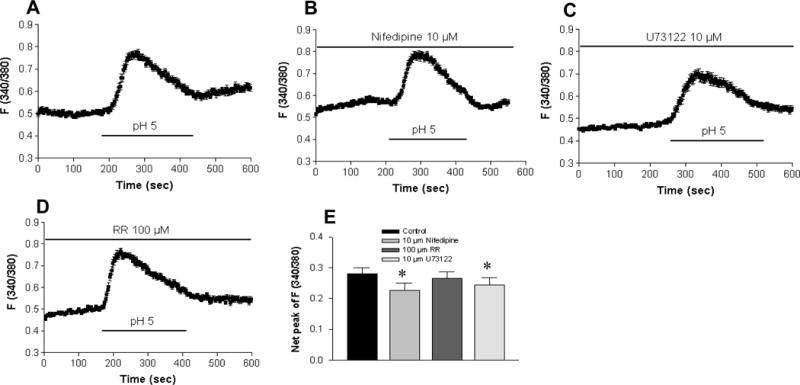
Figure 4. The minor component of acidosis-induced Ca2+ mobilization is via the other Ca2+ entry pathways in HT29 cells.

A: Superperfusion with Ca2+-containing solution (pH 5.0) induced a rise in [Ca2+]cyt in a control experiment. The acidosis-induced rise in [Ca2+]cyt was slightly reduced by nifidepine (10 μM; B), U73122 (10 μM; C). However, ruthenium red (100 μM; D) did not significantly affect this acidosis-induced rise in [Ca2+]cyt. E: Summarized data showing net peak of [Ca2+]cyt rise induced by pH 5.0 in the cells exposed to different treatments. Values are mean ± SE, n =49–50 cells for each tracing or bar. *P < 0.05 vs. control with Ca2+-containing solution in the absence of inhibitors.
