
Figure 5. Acidosis and ATP causes different time courses of [Ca2+]cyt in HT29 cells.
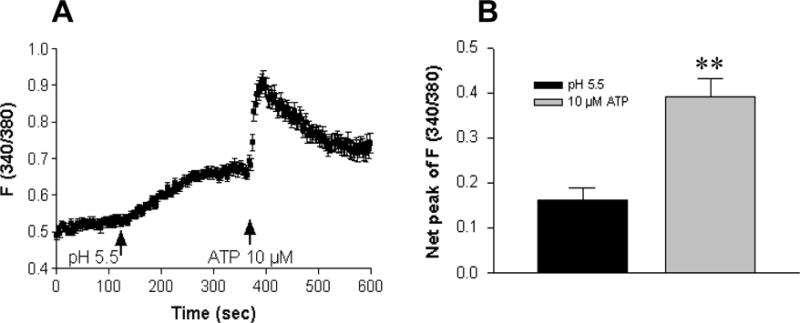
A: A slow rise in [Ca2+]cyt was first induced by extracellular acidosis of pH 5.5, and further induced by ATP (10 μM) with an immediate peak. B: Summarized data showing net peak of [Ca2+]cyt rise induced by pH 5.5 or ATP (10 μM). Values are mean ± SE, n = 50 cells for each tracing or bar. **P < 0.01 vs. pH 5.5.