
Fig. 1.
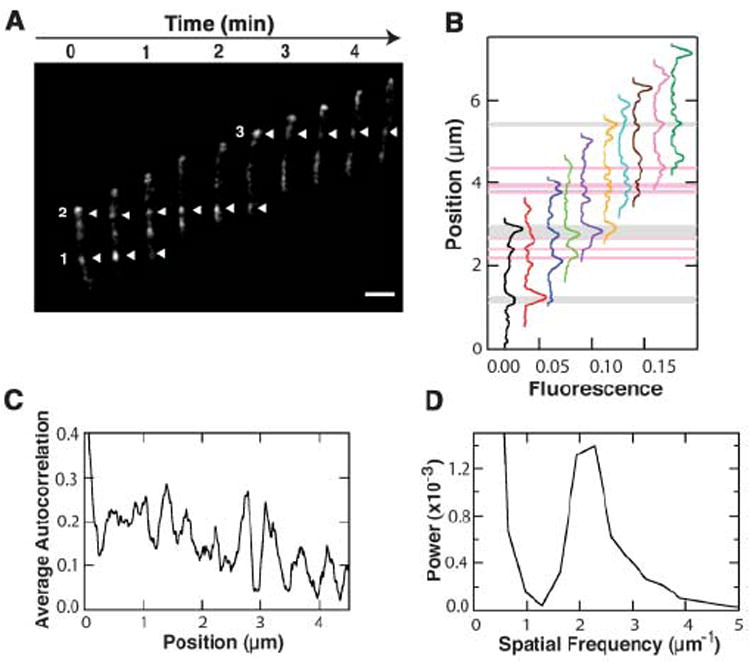
AglZ-YFP localizes to periodic sites that remain fixed relative to the substratum. (A) AglZ-YFP localization in a cell moving at constant velocity. Fluorescence micrographs captured every 30 s are shown. Numbered arrowheads highlight selected bright fluorescence clusters. Scale bar, 1 μm. (B) Line scans of fluorescence intensity as a function of position are shown for each movie frame in (A). For display purposes, individual scans have been shifted horizontally with time. Gray bars represent the three highest peaks in the average line scan, matching the positions of clusters 1 to 3 in (A). Pink bars denote all additional peaks found in the average scan. (C) Quantitative analysis of the AglZ-YFP fluorescence distribution in moving cells. The auto-correlation function of the thresholded line scan from six moving cells was averaged and displayed. (D) Power spectral density of the autocorrelation function.