
Figure 4.
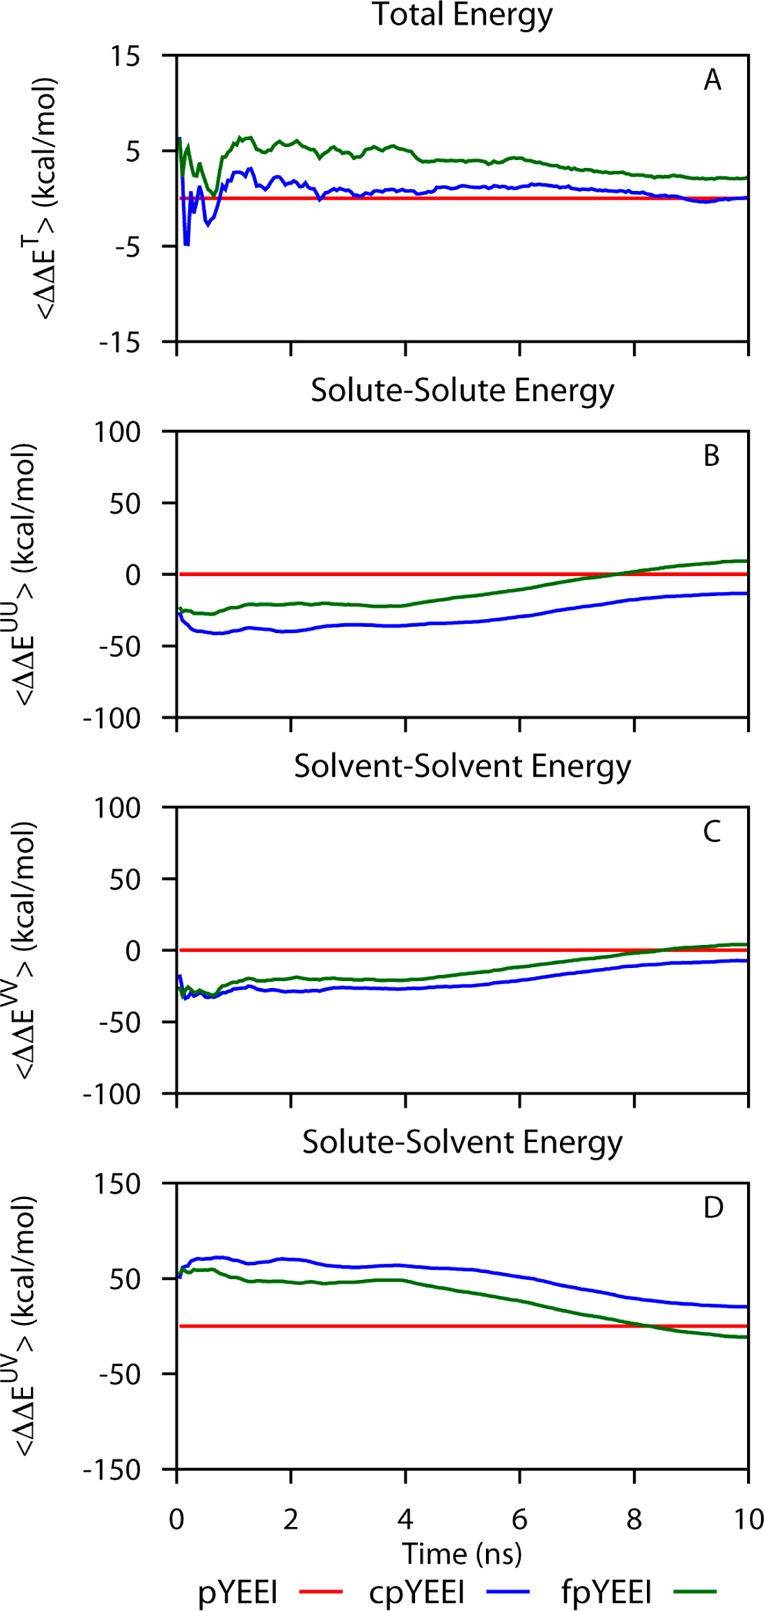
Convergence of cumulative averages as in Figure 2 for the decomposition of relative binding energies into solute and solvent contributions for the three SH2 complexes. (A) Total potential energy shown for comparison (note the difference in scale of the ordinate between the total potential energy and the component terms.); (B) solute–solute energy; (C) solvent–solvent energy; (D) solute–solvent energy. All difference terms are calculated relative to values for Src SH2–pYEEI.