
Figure 1.
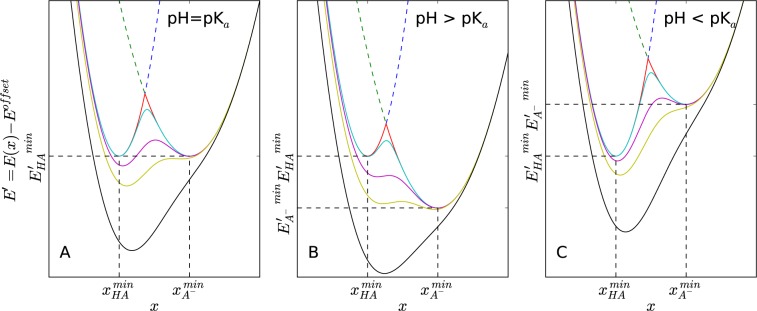
Schematic representation of EDS Hamiltonians (solid lines) mixing protonated (HA, blue dashed line) and deprotonated (A–, green dashed line) states for constant pH simulations under various pH conditions: (A) pH = pKa, (B) pH > pKa, and (C) pH < pKa. The difference between energy minima of each protonation state is determined by eq 8. Five EDS Hamiltonians constructed with different smoothness parameters are illustrated: s = ∞ (red), s = 0.7 (cyan), s = 0.22 (purple), s = 0.15 (yellow), s = 0.08 (black). Note that a smaller s value leads to a smoother EDS Hamiltonian with a lower energy barrier. If s is small enough, an EDS Hamiltonian has a single energy minimum, which is different from the energy minima of either original end state.