
Figure 7.
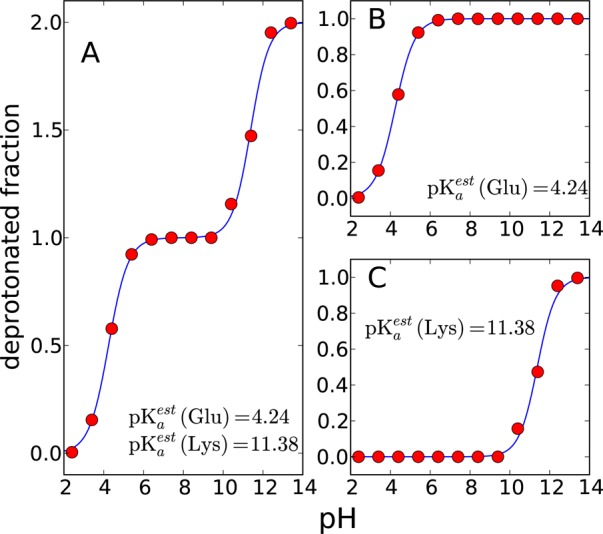
Titration curves of KAAE peptide in explicit water. (A) The macroscopic, the sum of deprotonated fractions of glutamic acid and lysine, and two microscopic titration curves of (B) glutamic acid and (C) lysine are illustrated. The average deprotonated fractions of three 1 ns simulations are shown as red dots. The fitted titration curves are shown as solid lines.