
Figure 9.
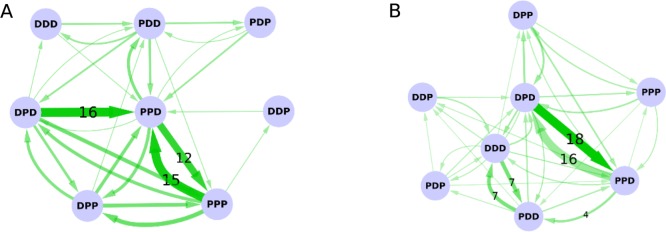
Summary of protonation state transitions at pH (A) 2 and (B) 3 are shown. Each node represents a protonation state and the width of the edge is proportional to the average number of transitions observed. The numbers of the most frequently observed transitions are displayed on the edges. The thinnest edge corresponds to only one transition from three sets of EDS-HREX simulations.