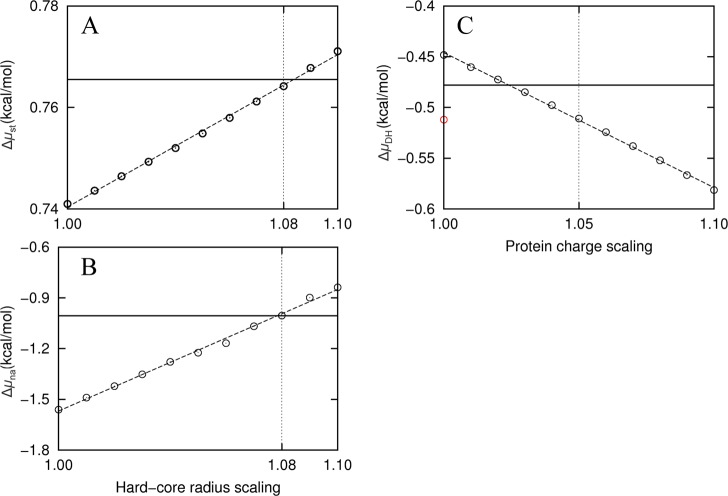
Figure 6.
Corrections of FMAP at 0.6 Å grid spacing, illustrated using the results for native cytochrome b562 in 100 g/L of lysozyme. (A) Correcting for Δμst by inflating the hard-core radii when detecting for protein–crowder clash. The extrapolated benchmark is shown as a solid horizontal line; the FMAP results calculated at 0.6 Å grid spacing but with hard-core radii inflated by 1% to 10% are shown as circles. (B) Δμna calculated after filtering of grid points using inflated radii. (C) ΔμDH at I = 0.15 M. The value before filtering of grid points is shown as a red circle. After filtering with 8% radius inflation, ΔμDH had a smaller magnitude than the extrapolated benchmark. Scaling up by ∼3% would correct the underestimate in this case, but on average 5% correction is needed at I = 0.15 M for all the protein–crowder combinations studied.

