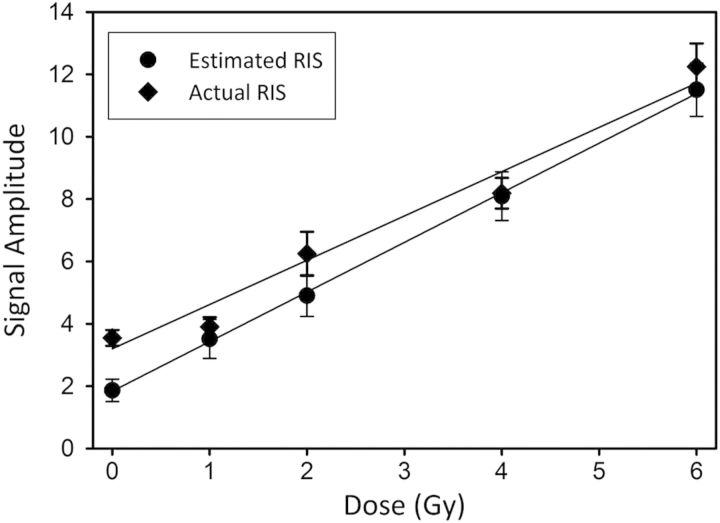
Figure 10.
Plots of the mean estimated RIS (circle) and actual RIS (diamond) amplitudes for all 15-donor nail sets calculated without the background included during the spectral fitting. The error bars represent the standard error of the mean. The lines represent the linear regression analysis of the dose response of the estimated and actual RIS amplitudes calculated for all 90 nail clipping samples.

