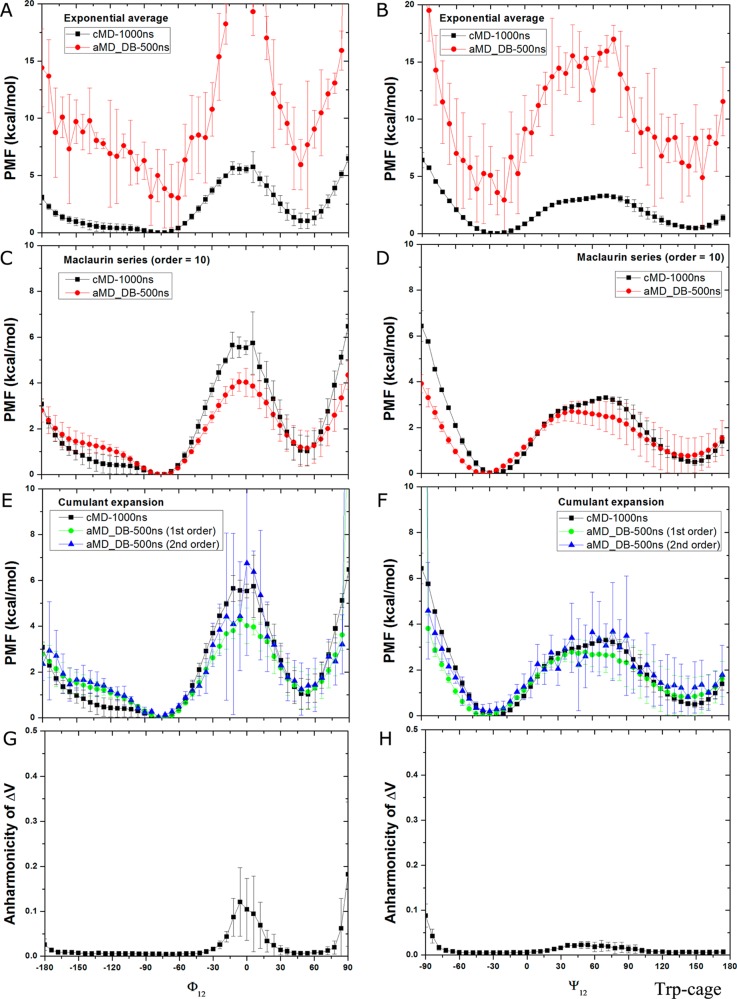
Figure 8.
Free energy profiles of backbone dihedrals Φ12 and Ψ12 in Trp-cage calculated by reweighting four independent 500 ns dual-boost aMD simulations: (A, B) exponential average, (C, D) Maclaurin series expansion to the 10th order, (E, F) cumulant expansion to the 1st and 2nd orders. The free energy profiles obtained from two independent 1000 ns cMD simulation are also plotted for comparison. The distribution anharmonicity of ΔV in the aMD simulations are plotted in (G) Φ12 and (H) Ψ12.

