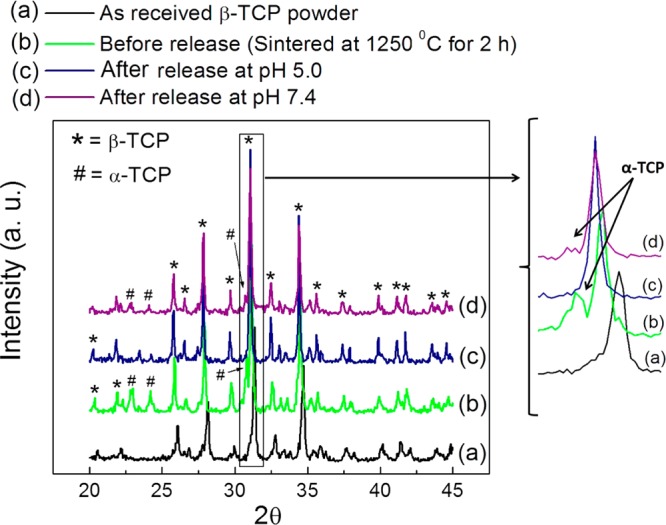
Figure 5.

XRD patterns of the 3DP TCP scaffolds before and after AD release. The major peak for α-TCP disappeared after AD release at pH 5.0 due to high dissolution of α-TCP as shown in (c). The intensity of the Major peak for α-TCP was decreases at pH 7.4 because of low dissolution of α-TCP at pH 7.4 as shown in (d). Other than this, no phase change was observed.
