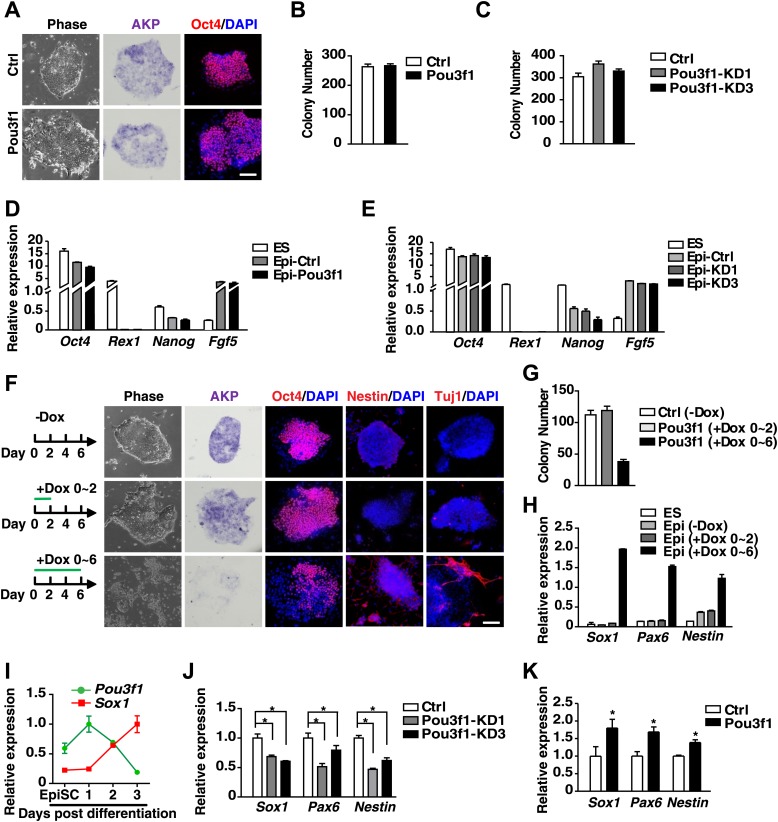
Figure 2. Pou3f1 promotes the neural differentiation from EpiSCs to NPCs.
(A) Inducible Pou3f1-overexpressing ESCs were cultured as EBs for 2 days in the medium with or without Dox and then subjected to the ESD-EpiSC colony formation assay for 6 days in Dox-free CDM/AF medium. EpiSC-like colony cellular morphology, alkaline phosphatase activity (AKP) (purple), and Oct4 immunostaining (red) are presented. Scale bars, 100 μm. (B) Statistical analysis of EpiSC-like colonies in A. (C) Statistical analysis of EpiSC-like colonies from the control-ESCs and from Pou3f1-knockdown ESCs (Pou3f1-KD1, Pou3f1-KD3) in the ESD-EpiSC colony formation assay. (D) Gene expression levels in ESCs and in EpiSC-like colonies formed in A. (E) Gene expression levels in ESCs and in EpiSC-like colonies formed in C. (F) EpiSC-like colonies from control-ESCs (−Dox), short-term Pou3f1-overexpressing ESCs (+Dox 0–2), and from long-term Pou3f1-overexpressing ESCs (+Dox 0–6) in the ESD-EpiSC colony formation assay. Cellular morphology, AKP activity, and immunostaining for Oct4, Nestin, or for Tuj1 with DAPI are presented. Scale bars, 100 μm. (G) Statistical analysis of EpiSC-like colony numbers described in F. (H) Gene expression levels of ESCs and of the EpiSC-like colonies described in F. (I) Expression profiling of Pou3f1 and Sox1 during EpiSC neural differentiation in serum-free medium. (J) Gene expression levels of control and Pou3f1-knockdown EpiSCs in serum-free medium at differentiation day 2 were determined by Q-PCR. (K) Gene expression levels of control and Pou3f1-overexpressing EpiSCs at unbiased EBs differentiation day 2 were determined by Q-PCR. The values represent the mean ± SD for B–E and for G–K. (*p<0.05).

