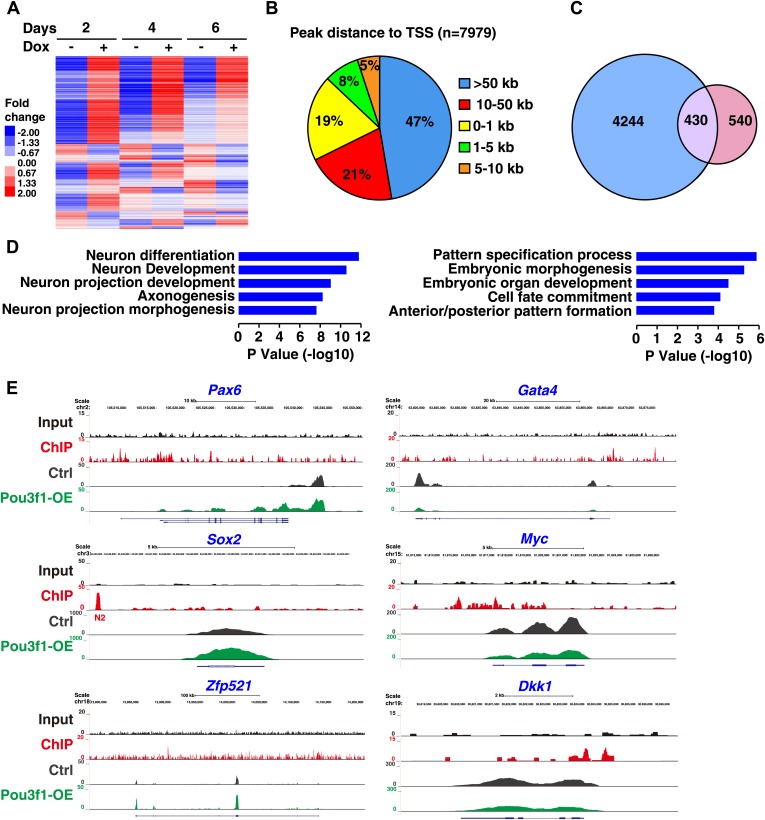
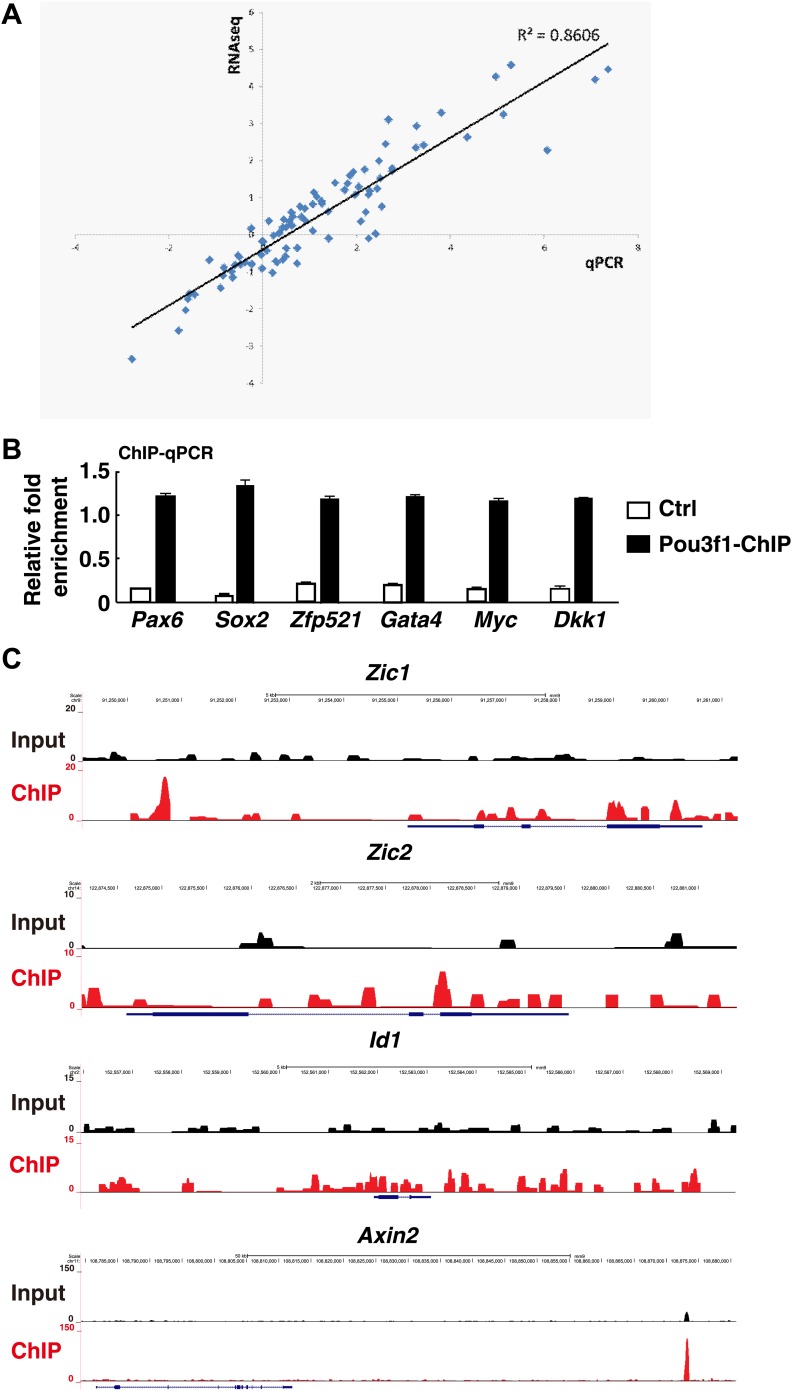
Figure 4. RNA-seq and ChIP-seq analysis of Pou3f1 downstream targets.
(A) RNA-seq gene expression heat map of control and of inducible Pou3f1-overexpressing ESCs with Dox-treatment for 6 days. Heat-map colors (red, up-regulation; blue, down-regulation) indicate gene expression in units of standard deviation from the mean of all samples. (B) Analysis of Pou3f1-enriched regions in the ChIP-seq assay. Pie chart showing the percentage distribution of Pou3f1-binding peaks in each category. The ChIP-seq assay was performed with Pou3f1-overexpressing ESCs at differentiation day 4. (C) Venn diagram depicting the overlap (purple) of Pou3f1-bound genes (blue) and genes with significantly altered expression upon Pou3f1 overexpression (pink) at differentiation day 4. Statistical significance was estimated by Fisher's exact test (p<4.71e−75). (D) GO analysis of biological processes of the overlap genes described in C. Many genes involved in neural differentiation processes were up-regulated, whereas a few genes related to pattern specification were down-regulated. Log p value was used to rank the enrichment. (E) Genome browser view of the distribution of the ChIP-seq and RNA-seq reads of represented genes. The upper panels show the Pou3f1-binding regions identified by ChIP-seq (black, input; red, Pou3f1-binding site at genomic loci), and the lower panels depict the RNA-seq reads of the represented genes in control ESCs (gray) and in Pou3f1-overexpressing ESCs (green) at differentiation day 4.


