Figure 3.

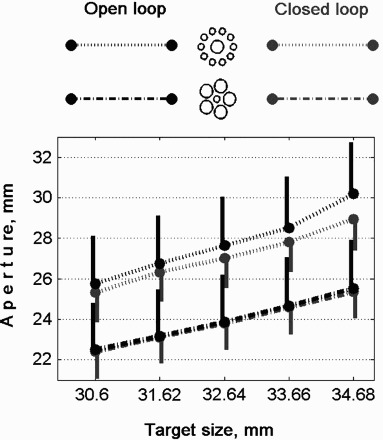
Manual estimates as a function of the array of surrounding circles and the size of the target circle size. Bars represent the standard error of subjects' mean responses.

Manual estimates as a function of the array of surrounding circles and the size of the target circle size. Bars represent the standard error of subjects' mean responses.