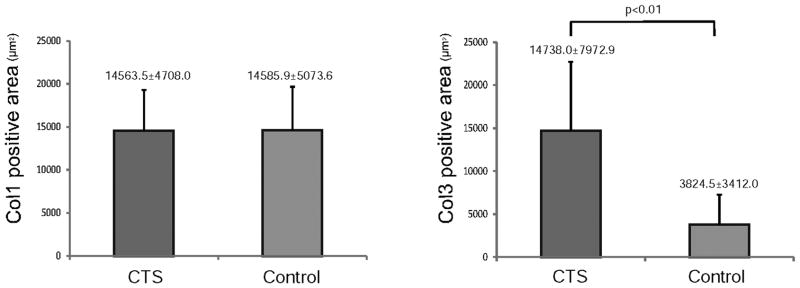
Figure 3.

Comparison of the Col1 (A) and Col3 (B) positive area between CTS patients and controls. There was no difference in Col1 positive area comparing CTS patient and controls (A), but the Col3 positive area in the CTS patients was significantly larger than that in the controls (B).
