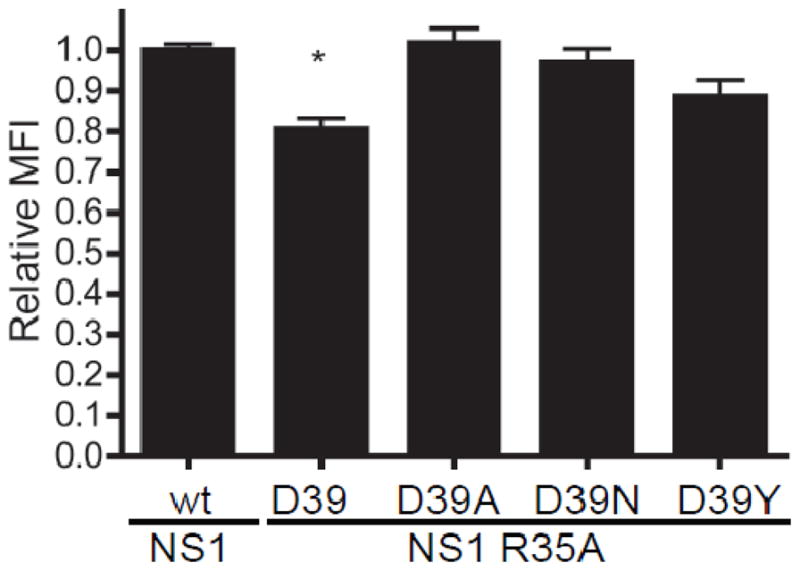
Figure 6.

Expression levels of Influenza A virus NS1 proteins. MCDK cells were transfected with plasmids encoding the indicated proteins. At nine hours post transfection, NS1 expression was quantified by flow cytometry. The MFI of the NS1 positive cells was determined and the mean and standard error of the mean are graphed. Signficant differences between rWSN NS1 and rWSN are indicated with an asterisk (*), p < 0.01 using a one-way ANOVA and a Bonferroni multiple comparison post test. MDCK cells transfected with control plasmids showed no reactivity with the NS1 antibody.
