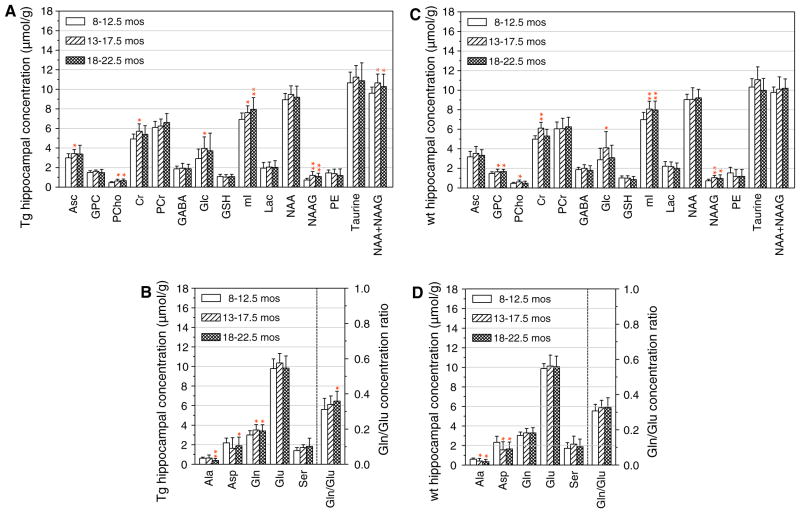
Fig. 3.
Effects of the aging process on the concentration of neuro-chemicals in the hippocampus of Tg (a, b) and wt (c, d) mice. The concentrations of some of the amino acids as well as the ratio of Gln to Glu concentrations are shown in b and d. In b and d, the right hand ordinate shows the numerical values of the Gln to Glu ratios. The age groups of the Tg and wt mice were 8–12.5, 13–17.5, and 18–22.5 months old as indicated in the figures. The group size for Tg and wt mice at each age are described in the “Methods” section. Statistical comparisons were between the concentration values for the 13–17.5 or the 18–22.5 month-old mice and those of the 8–12.5 month-old mice. The symbols (single asterisks) and (double asterisks) indicate statistically significant differences with p values of 0.01 <p <0.05 and p <0.01, respectively

