Figure 5.
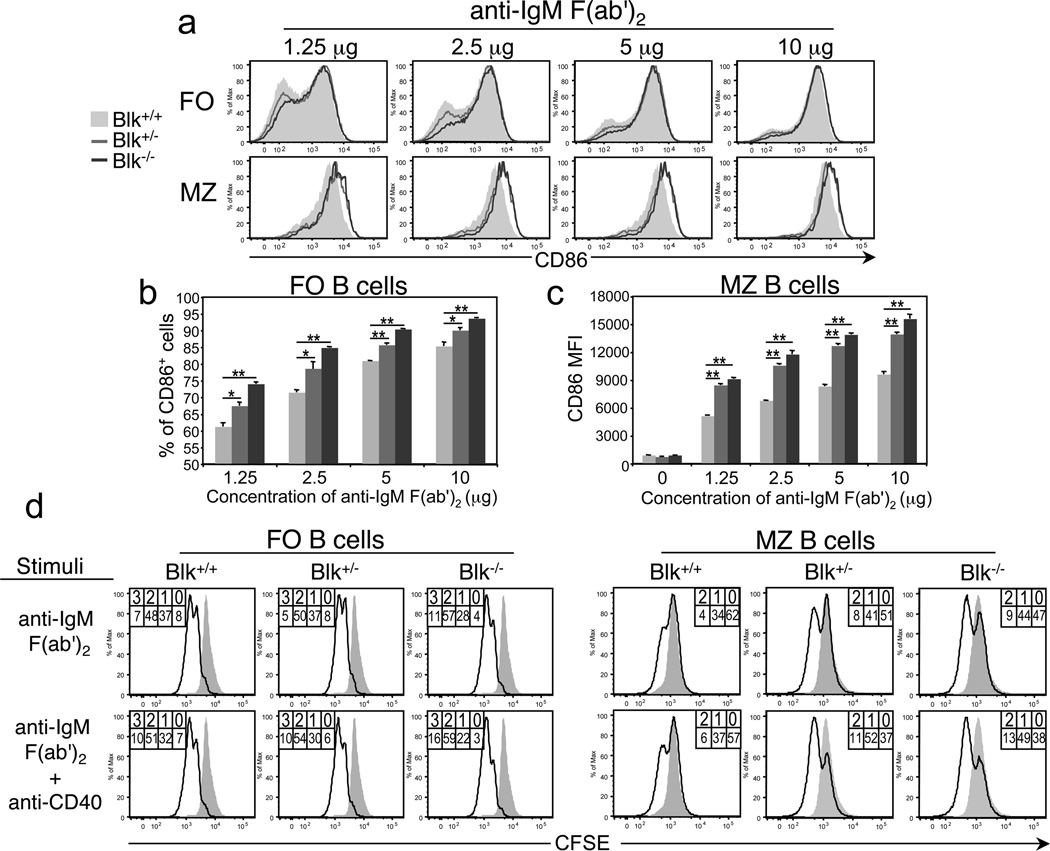
Effects of Blk-haploinsufficiency and -deficiency on B cell activation in vitro. (a) Upregulation of CD86 expression following BCR stimulation. Splenocytes from Blk+/+, Blk+/− and Blk−/− mice were plated and then stimulated with varying doses (1.25, 2.5, 5, and 10 µg/ml) of goat anti-mouse F(ab')2 anti-IgM for 24 hours. Histograms show CD86 expression on gated MZ (CD21hi CD1d+ IgDlo) and FO (CD23+ IgDhi) B cells from Blk+/+ (shaded histogram), Blk+/− (gray histogram) and Blk−/− (dark gray histogram) mice. Data are representative of three independent experiments. (b) Summary of FO B cell data presented in a. Comparison of the percentages of CD86+ FO B cells among Blk+/+ (light gray bars), Blk+/− (gray bars) and Blk−/− (dark gray bars) mice as a function of antigen dose. *p ≤ 0.05, **p ≤ 0.01. (c) Summary of MZ B cell data presented in a. Comparison of the mean fluorescence intensity of CD86 on MZ B cells from Blk+/+ (light gray bars), Blk+/− (gray bars) and Blk−/− (dark gray bars) mice as a function of antigen dose. **p ≤ 0.01. (d) Comparison of proliferative responses following BCR stimulation. Purified splenic B cells were labeled with CFSE and then stimulated with soluble anti-IgM (Fab’)2 (10 µg/ml) or with soluble anti-IgM (Fab’)2 (10 µg/ml) and anti-CD40 monoclonal antibody (1 µg/ml). After 72 hours, cells were harvested, stained with monoclonal antibodies against various surface antigens to identify and gate FO and MZ B cells subsets, and then proliferation was assessed by flow cytometric analysis. The percentage of cells within each CFSE peak is given. The overlay histograms show representative CFSE levels in unstimulated B cells. Data are representative of two independent experiments, with 4 mice per genotype.

