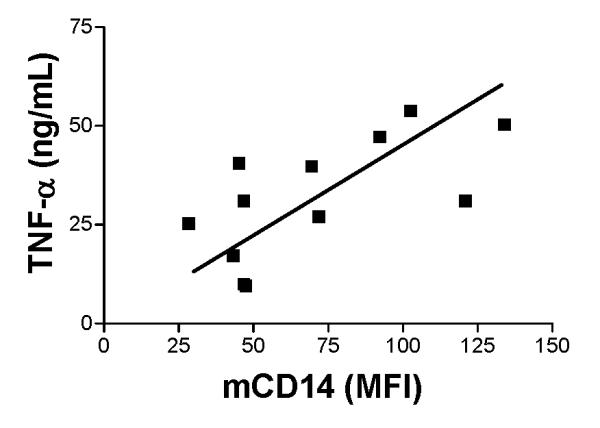
Figure 8.

Positive correlation between the production of TNFα and expression of mCD14 on AM exposed to E. coli as the second stimulus. Rabbit AM were pretreated with PBS, LPS, or E. coli for 24 hours and then exposed to E coli and the amount of TNFα produced in response to the second challenge with E. coli was determined. TNFα was measured in AM supernatant using an ELISA for rabbit TNFα and the amount of mCD14 on AM was quantitated with flow cytometry using a goat anti-rabbit CD14 polyclonal antibody. Correlation between mCD14 and TNFα was analyzed using Pearson’s coefficient of correlation (r = 0.065; p = 0.02).
