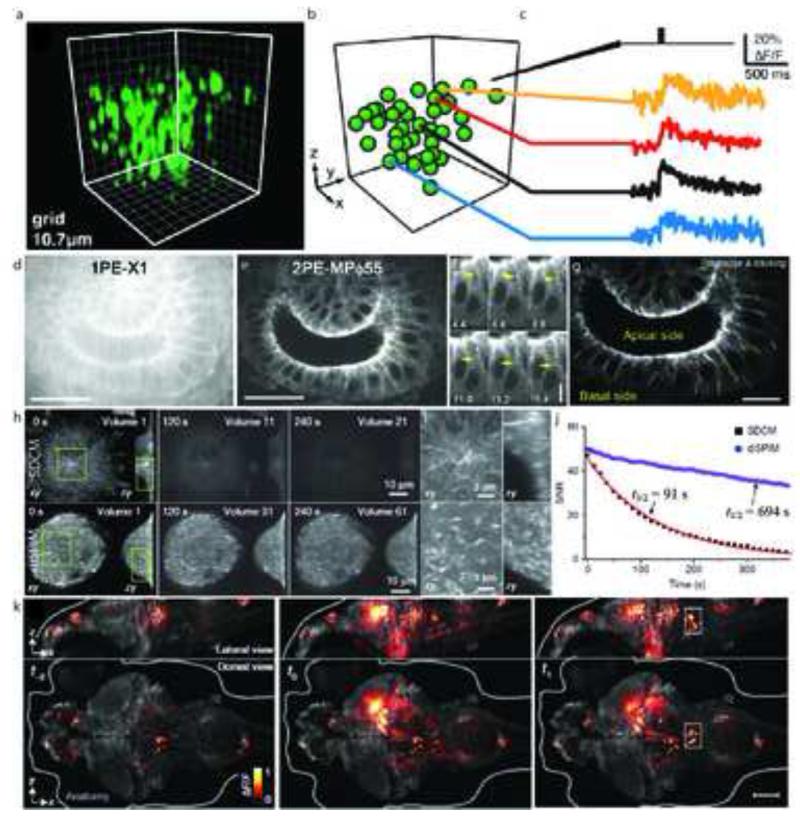
Fig. 2. High speed imaging at the diffraction-limit.
(a) Functional imaging of cortical neurons was performed in tissue slabs with a temporal resolution of 1kHz, along a cyclic trajectory. The image shows a 3D rendering of neurons of interest in the scan volume (100×100×100μm) loaded with OGB1-AM. (b) Segmentation of (a) representing neurons as spheres. (c) Fluorescence measurements from selected neurons in response to stimulation with an extracellular electrical burst. (d) 1PE and (e) 2PE excitation images of a live drosophila embryo expressing EB1-GFP. Images were collected approximately 25 μm into the sample and consisted of horizontal sections of the hindgut as observed from the dorsal side. EB1 comets, indicated by yellow arrows (f) are observed in 2PE, but not 1PE. (g) Tracked EB1 comet paths are shown with colored lines. (h) Bleaching comparison between SDCM and diSPIM, on cells expressing EB3-GFP. At similar initial SNR, cells imaged with SDCM were sampled 3× less frequently than diSPIM and with 3.2× fewer planes per volume, but exhibited greatly increased bleaching rates. (i) Higher magnification views of the rectangular subregions indicated in (h), emphasizing the superior axial resolution obtained in diSPIM compared to SDCM. (j) Bleaching rates were calculated from a 20×20 μm area inside each cell; SNR was calculated as the ratio of the measured area inside the cell to an area outside the cell. Data were fitted to single exponentials; bleaching half times are indicated on the graph. (k) Whole brain imaging of neuronal activity in live Zebrafish embryos reported by GCaMP5G, a genetically encoded calcium indicator, in elavl3:GCaMP5G fish. Changes in GCaMP5G fluorescence are superimposed over the reference anatomy. Panels represent whole-brain volumes recorded at time intervals of 1.39 s. Nearly simultaneous activation of numerous neurons occurs at t0 spanning both the midbrain and hindbrain. Scalebars: (d,e): 20 μm; (f): 5 μm; (g): 10 μm; (k): 100 μm. Panels (a-c) are adapted from Botcherby et al. [3] with permission from PNAS. Panels (d-g) are adapted from Shimozawa et al. [6] with permission from PNAS. Panels (h-j) are adapted from Wu et al. [9] with permission from Nature. Panel (k) is adapted from Ahrens et al. [13] with permission from Nature.

