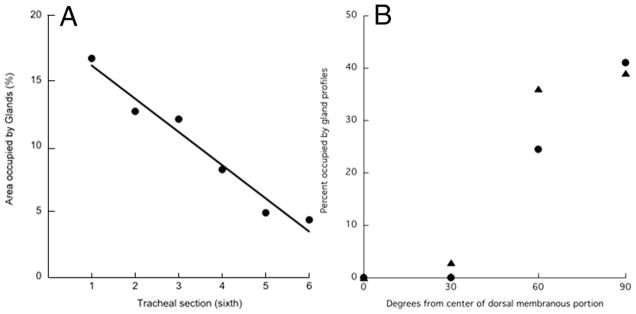
Fig. 3.

Distribution of glands along and around the trachea. A: Longitudinal distribution. Tracheas were split open longitudinally, cut into six equal lengths, stained with PAS, and the percentage of the area occupied by glands determined. Section 1 is most cephalad, and section 6 is most caudal. Results for one trachea. Exactly similar results were obtained on two other tracheas. B: Circumferential distribution. Results for anterior-most sixth of two tracheas, indicated by different symbols. Values at 30° and 60° are the averages of both sides.
