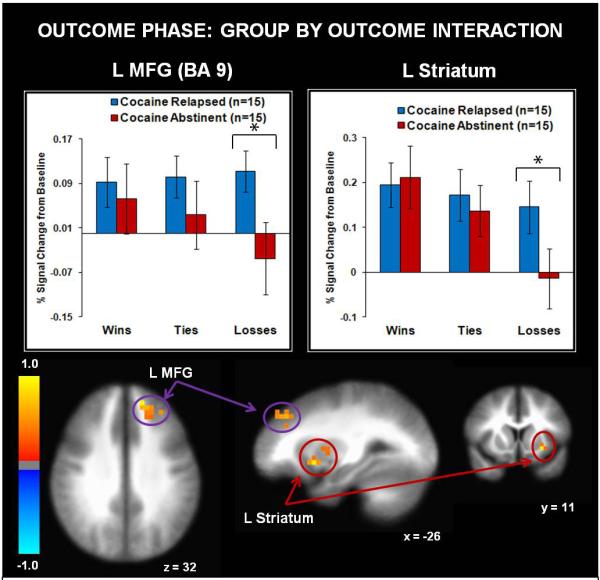
Figure 6.

Relapsed cocaine users exhibited greater activation than abstinent cocaine users in left middle frontal gyrus (MFG) and left striatum during losses. L = left hemisphere. R = right hemisphere. BA = Brodmann Area. Error bars denote +/− 1 standard error. Asterisks denote significant group differences. The color bar depicts normalized voxel intensity differences, with postitive values indicating greater intensity in the relapsed group than the abstinent group for losses.
