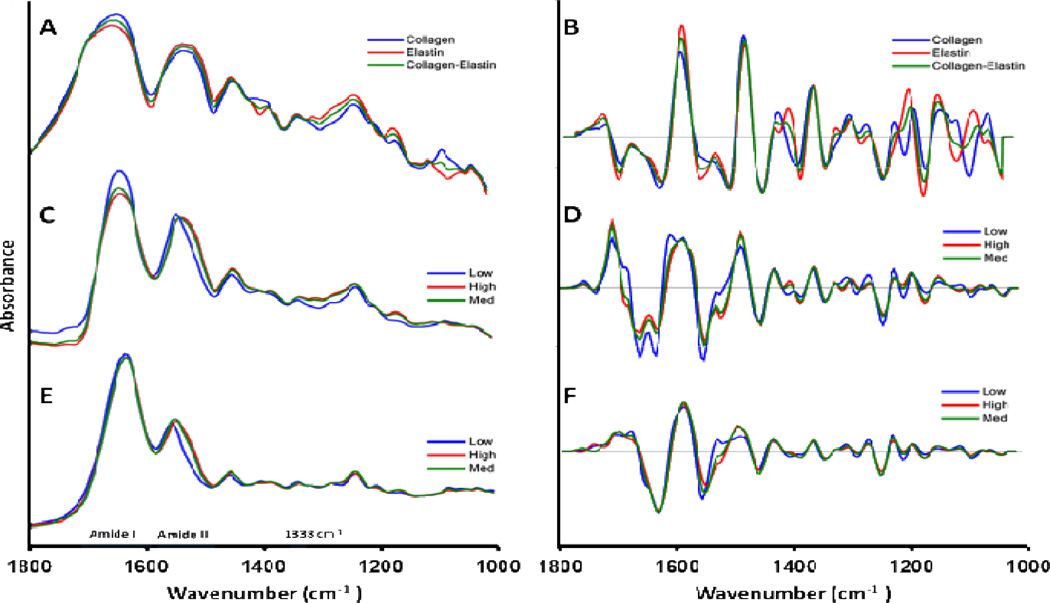
Figure 3.
Average spectra of samples with low, medium and high elastin content. A) Reference spectra of collagen-elastin KBr pellets, and B) second derivative of (A). C) FT-IRIS spectra, D) second derivative of (C), E) FTIR-IFOP spectra, and F) second derivative of (E). Samples in C and D were categorized into Low (0–26 %dw), Medium (27–52 %dw) and High (52–78 %dw) and samples in E and F were categorized into Low (0–5 %ww), Medium (8–14 %ww) and High (14–21 %ww) elastin content as measured by Fastin elastin assay. The numerical values for the spectra in this figure can be accessed as supplementary material.

