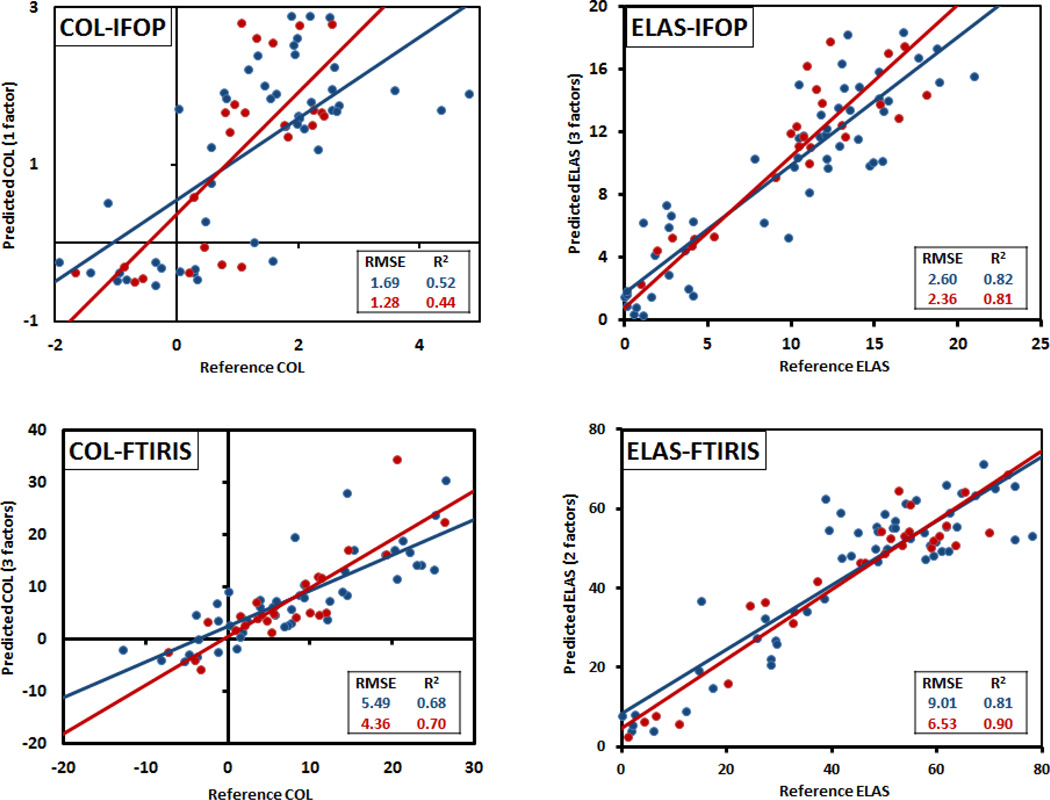
Figure 4.
Spectroscopically predicted vs. biochemically measured reference values for the developed PLS models as detailed in Table 1. Calibration set is marked in blue and validation set is marked in red. The number of factors in Y axis titles are the number of factors used to build the PLS model.

