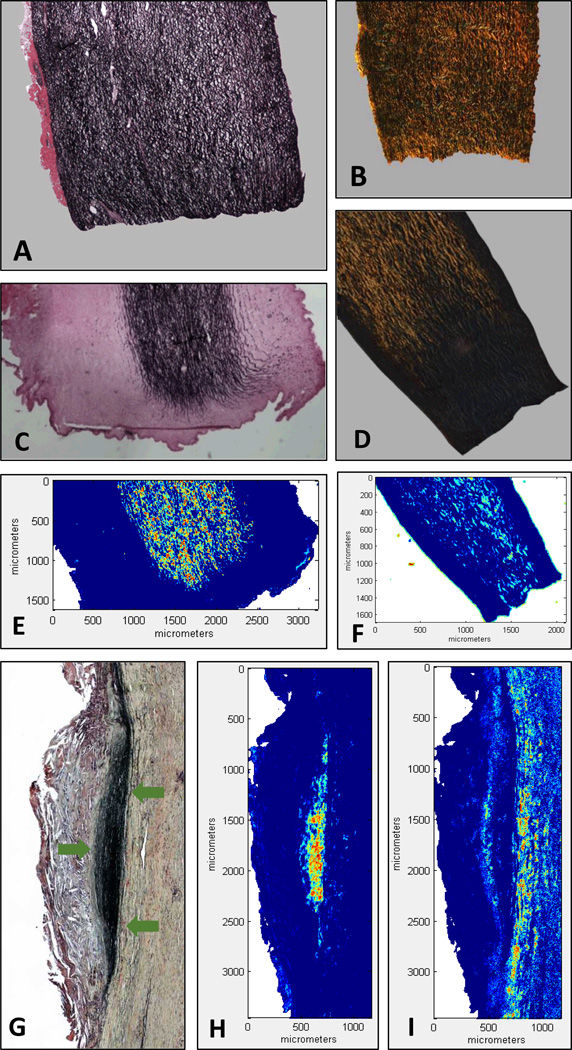
Figure 5.
Histological and FT-IRIS images of aorta samples. FT-IRIS images are intensity images in pseudo-color increasing in intensity from blue to red. A) Verhoeff-Van Gieson (VVG) staining of an untreated sample with elastin stained black. B) Polarized image of a picrosirius red staining of an untreated sample with collagen fibers visualized as bright yellow-orange. C) VVG staining of a sample treated with elastase for 5 hours. D) Polarized image of a picrosirius red staining in a sample treated with collagenase for 5 hours. E) FT-IRIS mapping of elastin in a consecutive section from the sample in (C). F) FT-IRIS mapping of collagen in a consecutive section from the sample in (D). G) Movat’s pentachrome staining of a section of a human AAA sample visualizing pathological aggregates of elastin fibers as black (area denoted with arrows), collagen as yellow-brown, proteoglycans in blue and fibrin in red. H) FT-IRIS mapping of elastin in the sample in (G). I) FT-IRIS mapping of collagen in the sample in (G).

