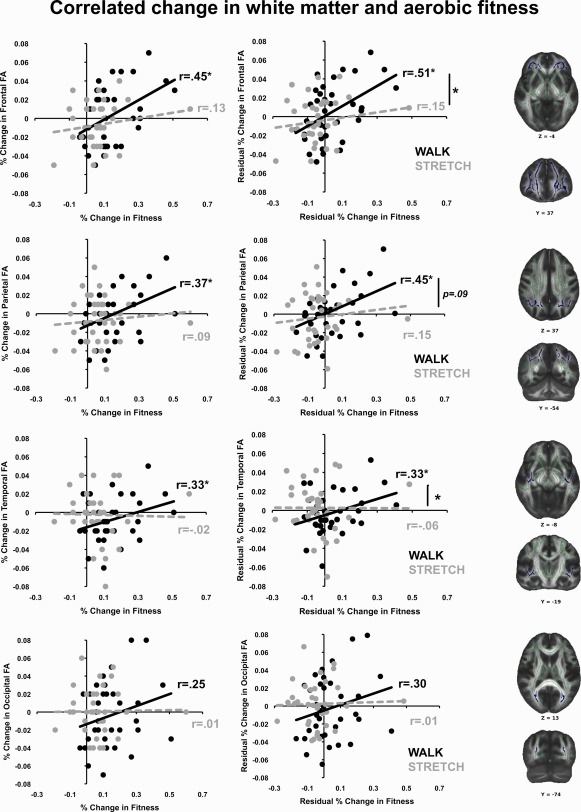
Figure 1.

Correlation between change in FA and aerobic fitness. Left and middle columns illustrate the patterns of increased fitness associated with increased regional FA for the walk (black) and the stretch (gray) groups. The left column plots raw data points; the middle column plots residuals, after correction for variance associated with age, sex, and program adherence. The right column illustrates representative views of the four a priori ROIs; ROIs (shown in blue) were manually defined on the mean skeleton (shown in green), according to the anatomical guidelines outlined in Head et al. 1987.
