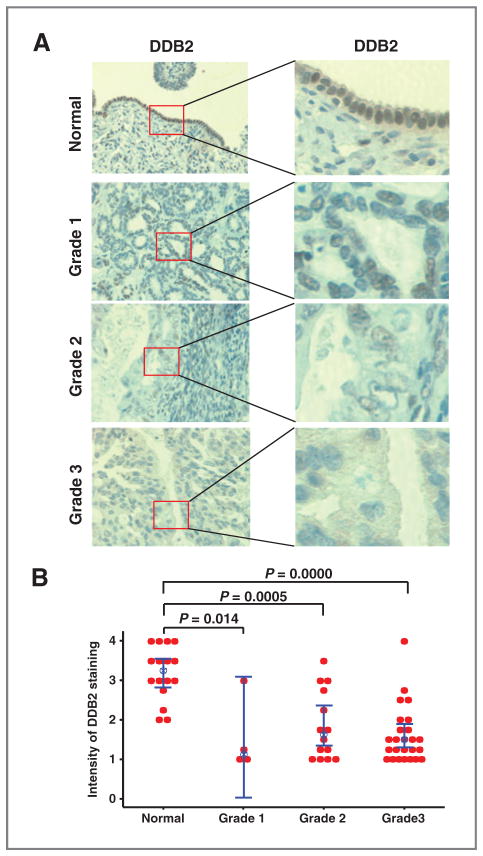
Figure 1.
Loss of DDB2 expression in ovarian cancer. DDB2 IHC of human TMA of normal ovary (n = 16), ovarian serous adenocarcinoma grade 1 (n = 4), grade 2 (n = 14), and grade 3 (n = 25). A, representative images of sections of each group are shown. B, intensity of DDB2 staining was scored from 1 to 4, and an individual value plot was generated to display the distribution of the intensity of DDB2 staining for normal ovary and ovarian cancer grade 1, 2, and 3. Bar, 95% confidence interval for the mean. Blue dot, median value. P value is calculated by the nonparametrics Mann–Whitney test.

