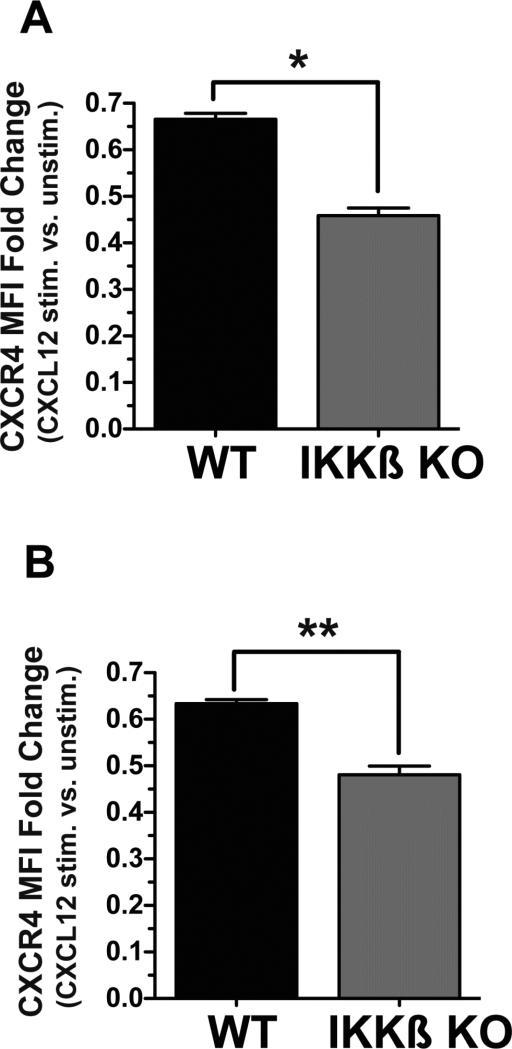
Figure 2. CXCR4 protein expression levels in Wt versus IKKβ conditional KO macrophages.
Mature macrophages derived from WT and myeloid cell conditional IKKβf/f:MLysCre mice were stained with anti-CXCR4 antibody after cell permeabilization to reveal total cellular CXCR4 protein expression (A), or without permeabilization to quantity cell surface CXCR4 levels (B) and then analyzed by flow cytometry. Data are shown as mean fluorescence intensities (MFI) from 4 independent experiments and are expressed as fold change of cells stimulated with CXLC12 (50 ng/ml) for 2 hr vs. unstimulated cells. *p<0.05 and **p<0.01 by one way ANOVA with Tukey's multiple comparisons post test.

