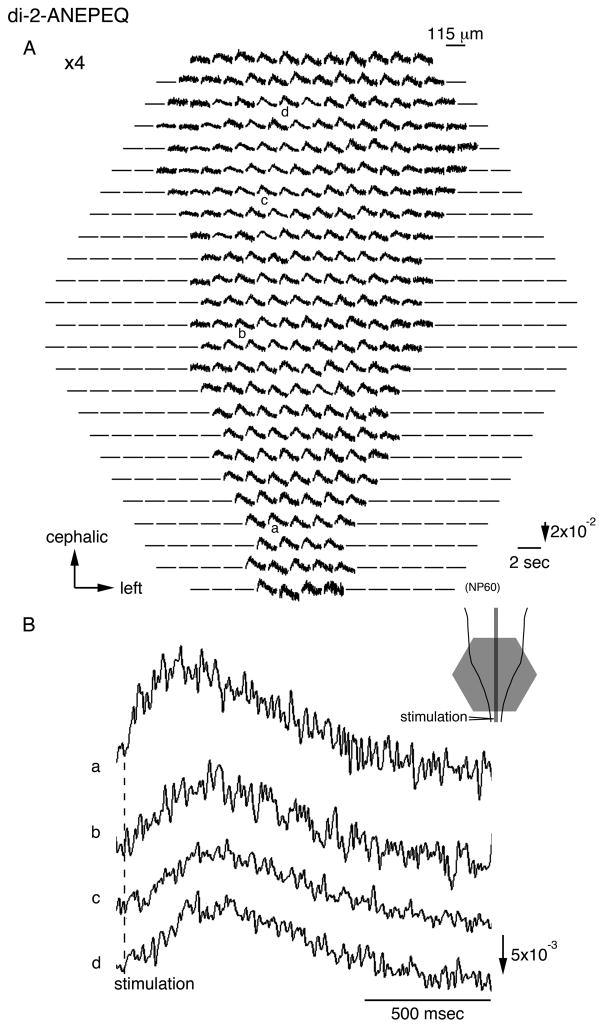
Figure 3.
A. Multiple-site optical recording of neural responses detected with a styryl fluorescence dye, di-2-ANEPEQ. The direction of the arrow in the lower right indicates an increase in fluorescence intensity, and the length of the arrow represents the stated value of the fractional change. Other experimental conditions were the same as those in Fig. 2. The fractional change was about five times larger than that in Fig. 2, but the S/N was lower because of larger noise. B. Enlarged traces of the optical signals detected from four regions indicated by a–d in A.

