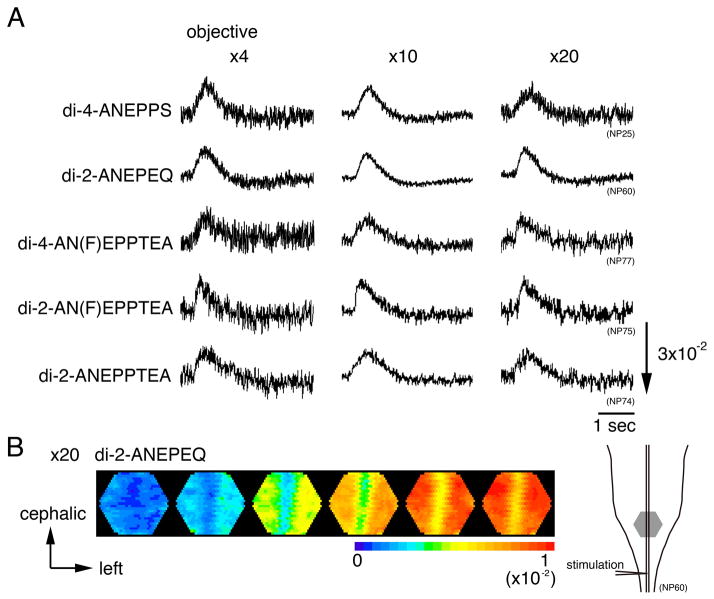
Figure 4.
A. Optical signals at various microscope magnifications. Optical recordings were made with an eyepiece (×1.67) and three objectives (×4, ×10, and ×20) for five fluorescence dyes and an absorption dye. B. An example of color-coded representations of the optical signal related to the depolarization wave. The preparation was stained with di-2-ANEPEQ, and the optical signals were detected with a magnification of ×20×1.67. An illustration of the preparations is shown on the right, and the detected area is marked with a gray hexagon. The frame interval was 50 msec. The stimulation was applied at the first frame.

