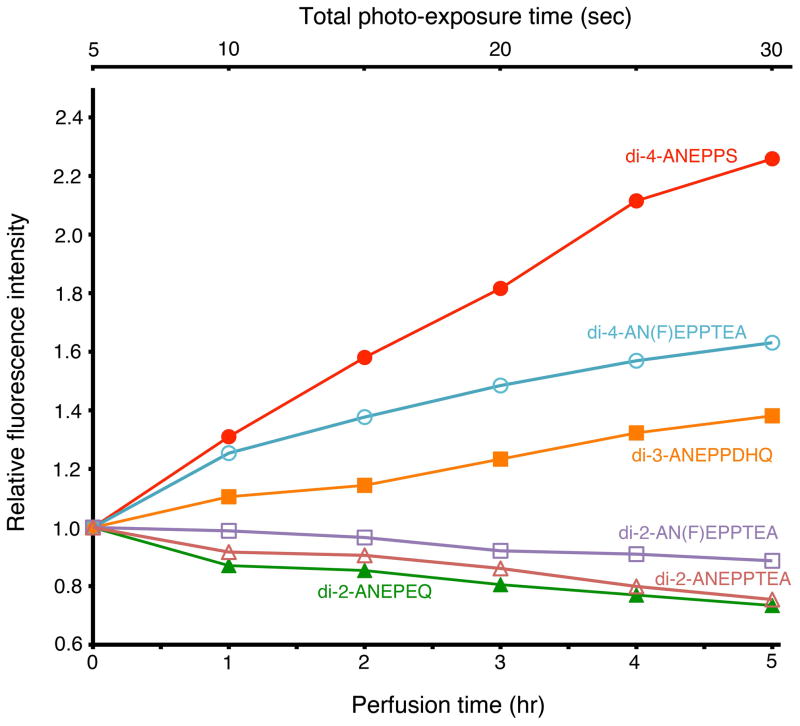
Figure 6.
Effects of perfusion on the fluorescence background intensity of the dye. The incident light was turned off except during the measuring period. The ordinate represents the relative fluorescence intensity (DC-background light intensity at each time divided by that at time 0). The lower abscissa is time after staining (perfusion rate: 1 ml/min), and the upper abscissa is the total illumination time.

