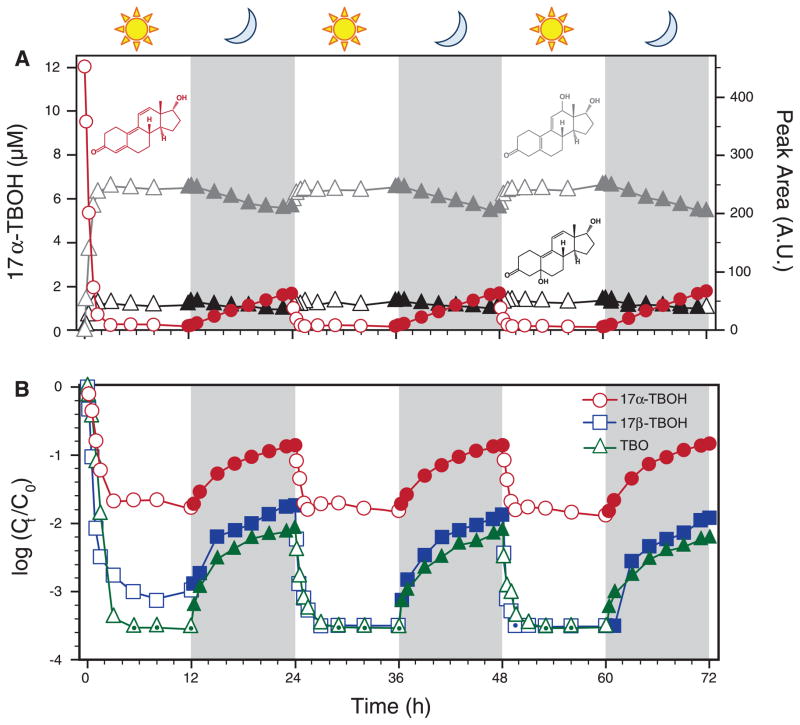
Fig. 1. Diurnal cycling of TBA metabolites.
(A) Day-night cycling of 17α-TBOH (red), 12-hydroxy-17α-TBOH (gray), and 5-hydroxy-17α-TBOH (black) at pH 7, 25°C. Data for 17α-TBOH are presented as aqueous concentration (left axis), whereas peak areas from spectrophotometric absorbance [wavelength (λ) = 350 nm for 17α-TBOH; λ = 254 nm for photoproducts] are also presented (right axis). (B) Corresponding data for 17β-TBOH and TBO, where symbols with a center dot indicate values below our detection limit. In these cases, data points correspond to this limit (~3 nM) for 17β-TBOH and TBO. Ct/C0, time-dependent concentration normalized to initial concentration; h, hours; A.U., arbitrary units.

