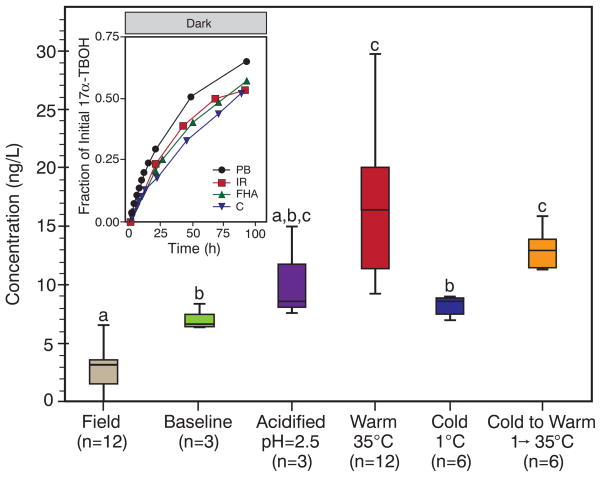
Fig. 4. 17α-TBOH dynamics in a field mesocosm and complex aquatic matrices.
After dosing the collection pond (at 22:00), field samples (n = 4, in triplicate) were analyzed over 17 hours. At sunset (15:00), the baseline sample was processed and split into subsamples, which were either acidified to pH 2.5, incubated [warm, temperature (T ) = 35°C], refrigerated (cold, T = 1°C), or refrigerated then incubated after 24 hours (cold to warm, T = 1° → 35°C). Group means are different [one-way analysis of variance: F(5,37) = 17.5, P <0.001] if groups do not share the same letter as other groups (Games-Howell post-hoc test: P < 0.05). Lines, boxes, and whiskers represent median, interquartile, and minimum and maximum values, respectively. The inset shows regeneration of 17α-TBOH in photoproduct mixtures (dark, 25°C) in solutions of 10 mg/liter Fluka Humic Acid (FHA), 250 mg/liter of bicarbonate as CaCO3 (C), and Iowa River water (IR; turbidity, 15.1 nephelometric turbidity units; alkalinity, 196 mg/liter as CaCO3; total hardness, 270 mg/liter as CaCO3; total dissolved organic carbon, 16.6 mg/liter; pH 8.2.). Provided for comparison are data from a phosphate buffer (PB) system. Unless noted, all systems were at pH 7. The rate of reversion is less in Iowa River water than would be expected for its alkaline pH, probably because of the slight inhibition observed in model systems with Fluka Humic Acid and bicarbonate.

