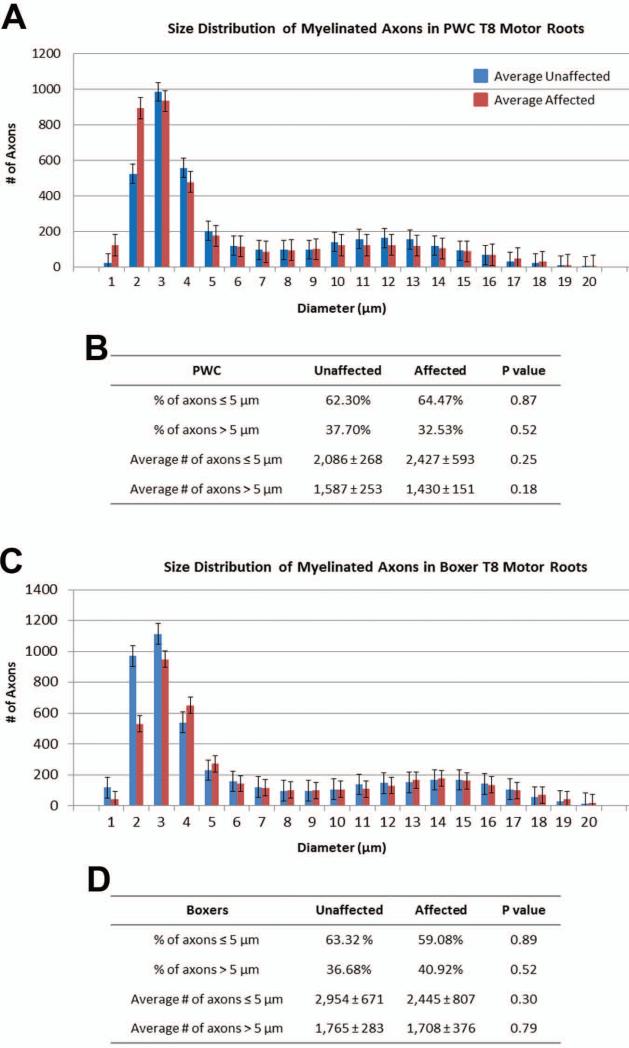
Figure 3.
Motor root myelinated axon diameter distribution from PWC's (A,B) and Boxers (C,D). Histograms show a bimodal size distribution with one peak representing small caliber axons, and one peak representing large caliber axons (A, C). For both breeds, no obvious differences could be seen between large caliber axons from control and affected motor roots, while the small caliber peak was more variable. (B, D) For both breeds, no statistical difference was seen in the percentage or average numbers of axons ≤5 μm >. Data represented in this figure were obtained from the same samples depicted in Tables IV and V.

