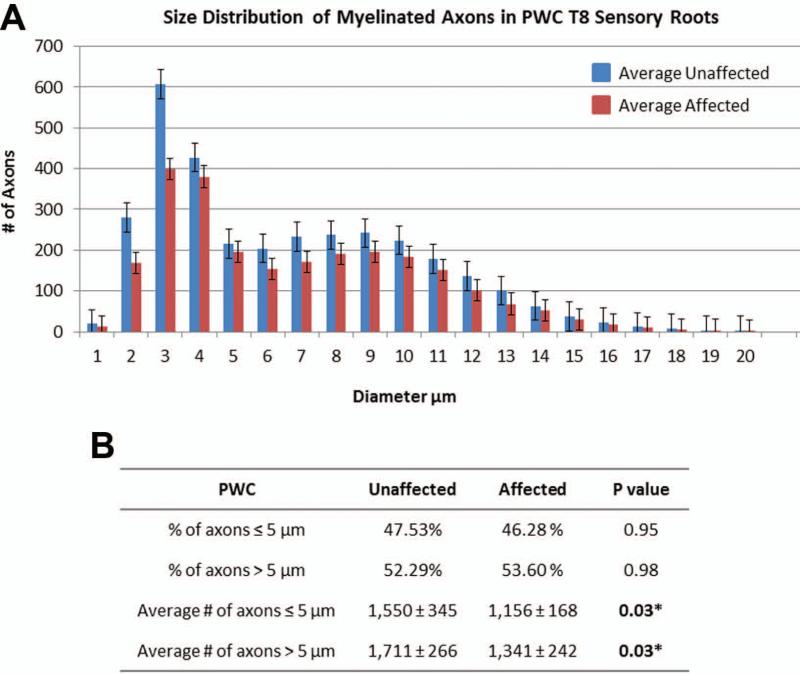
Figure 5.
PWC sensory root myelinated axon diameter distribution. (A)Histogram shows a bimodal size distribution with one peak representing small caliber axons, and one peak representing large caliber axons. (B) There was a statistically significant difference in the average number of axons ≤5 μm (p= 0.03) and >5 μm (p=0.03). Data represented in this figure were obtained from the same samples depicted in Table VI.

