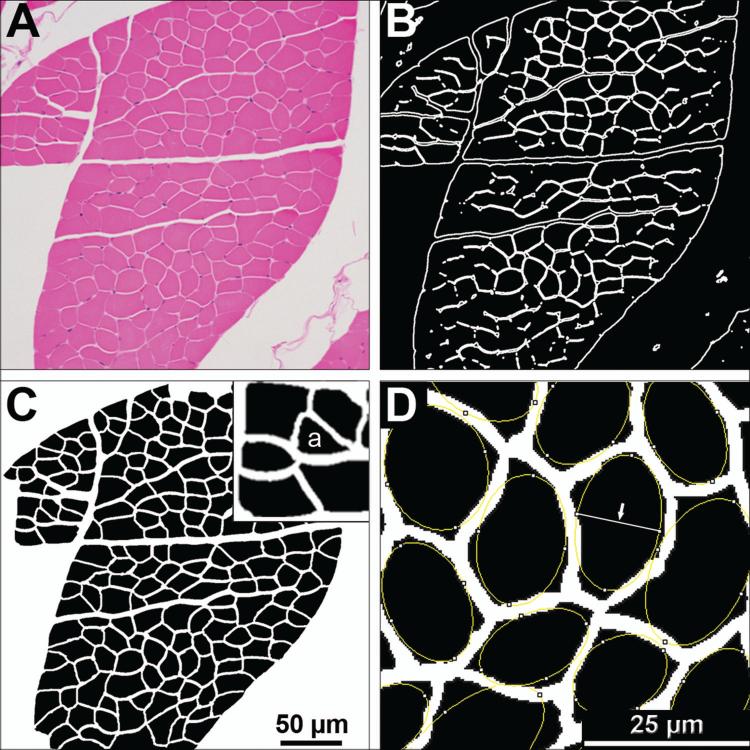
Figure 2. Method for morphometric analysis of myofibers.
(A) Hematoxylin and eosin stained intercostal muscle cross sections were imaged with light microcopy at a 200x magnification. (B) FijiTM or PhotoshopTM imaging software were used to generate a black and white segmented mask outlining the boundaries of each myofiber. (C) In PhotoshopTM, the mask was overlaid on the gray-scaled original image, transparency increased, and manual corrections were made to define the boundaries of each fiber. Once boundaries are defined, the corrected mask is thresholded in FijiTM, and a particle analysis tool was used to obtain measurements. Measurements include minor axis length, fiber cross sectional area, and roundness. (D) The minor axis is identified as the shortest axis of a best fit ellipse (Arrow). Pixels of this axis and of the cross sectional areas were converted to μm and μm2 respectively for each myofiber. The percent of angulated fibers (example labeled with “a” in insert of panel C) were determined manually by a masked evaluator.

