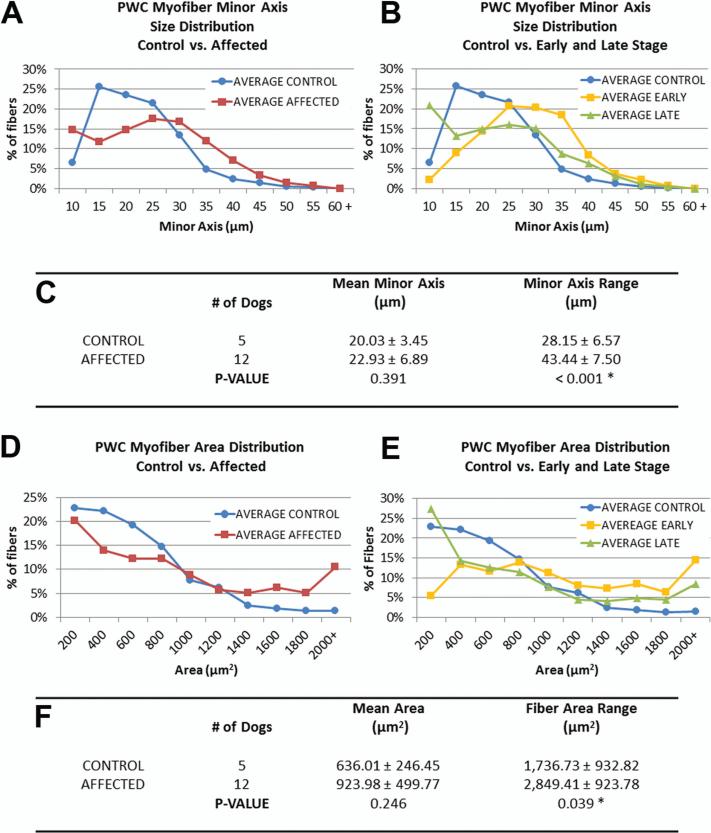
Figure 4. Morphometric data reveal increased variability of intercostal myofiber sizes in DM-affected PWCs.
(A, D) Size distribution graphs of myofibers from affected PWCs show changes in the distribution of fibers sizes (minor axis, and cross sectional area respectively). (B, E) Distribution graph of affected PWCs separated into early (n = 3) and late (n=9) stages. Early stage myofiber distributions were shifted towards larger size classes, while more small fibers were seen in the late stage distribution. (C, F) No significant difference was seen between the mean minor axis lengths or cross sectional area of unaffected and affected dogs; however the range of fiber sizes were significantly increased in affected PWCs (* p<0.05).

