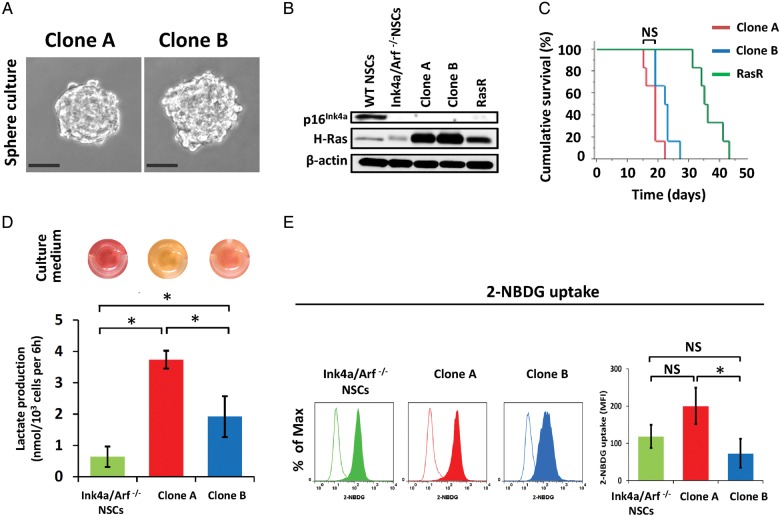
Fig. 1.
Establishment of GICs with different metabolic properties. (A) Spheres formed by clones A and B under neurosphere culture conditions. Scale bars, 50 μm. (B) Immunoblot analysis of p16Ink4a, H-Ras, and β-actin (loading control) in nontransformed NSCs/NPCs from wild-type (WT) or Ink4a/Arf–null mice, in clones A and B and in RasR cells. (C) Survival curves for wild-type mice (n = 6) after orthotopic implantation of clones A or B or RasR cells (1 × 10⁵ cells each). NS, not significant. (D) Lactate production by Ink4a/Arf–null NSCs/NPCs as well as by clones A and B. Data are means ± SD from 3 independent experiments. *P < .05. Images of the corresponding cell culture medium are shown above the bar graph. (E) Flow cytometric analysis of 2-NBDG uptake (solid traces) by Ink4a/Arf–null NSCs/NPCs as well as by clones A and B. Open traces, control. Data are representative of 3 independent experiments. Quantification of 2-NBDG uptake as difference in mean fluorescence intensity (MFI) between samples and controls. NS, not significant, *P < .05.

