Fig. 5.
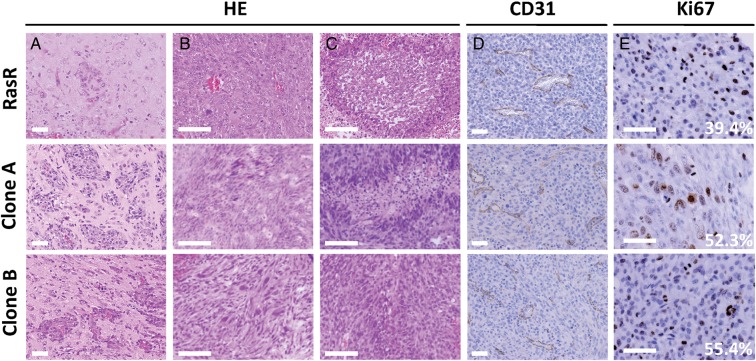
Histological analysis of tumors formed by clones A and B. Tumors formed 5 weeks after orthotopic implantation of RasR and 3 weeks after implantation of clones A or B into wild-type mice were evaluated by (A–C) hematoxylin-eosin (HE) staining as well as by (D) immunohistochemical staining of CD31 to detect blood vessels and (E) of Ki67 to detect proliferating cells. Invasion fronts are shown in (A), cellular pleomorphism in (B), and pseudopalisading in (C). The percentage of tumor cells positive for Ki67 is indicated in (E). Scale bars: 50 μm (A, D, E) and 100 μm (B and C).

