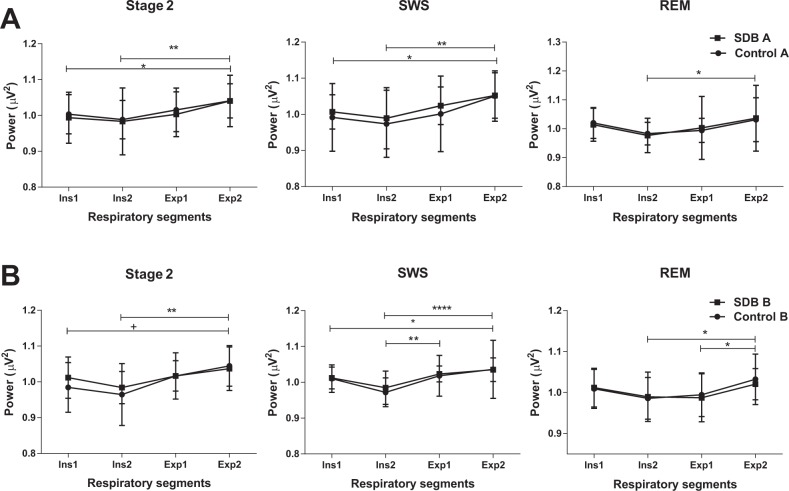
Figure 2.
Mean electroencephalograph power of the four respiratory segments (Ins1, Ins2, Exp1, and Exp2) averaged across subjects within the control and sleep disordered breathing (SDB) group (A) at baseline (B) at follow-up polysomnography (* P < 0.05, ** P < 0.01, **** P < 0.001). REM, rapid eye movement sleep; SWS, slow wave sleep.

