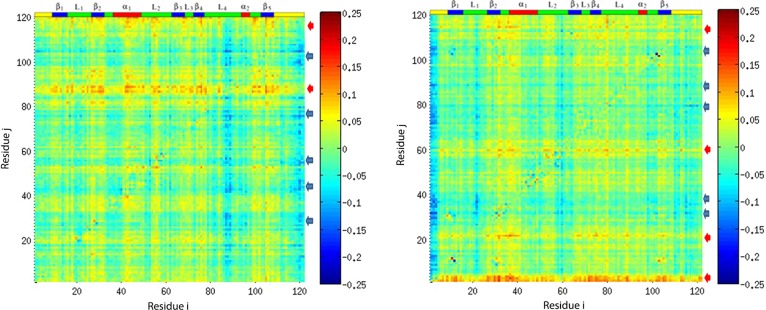
Figure 10.

Normalized directional index for plexin RBD in monomer (left) and dimer (right) forms with motion activator regions labeled in red arrows and motion responder regions labeled in blue arrows. Atom j is on the vertical, and atom i is on the horizontal axis. Positive values of Dj→i (in yellow and red) indicate that the information flow is from j to i, and atom j is the source of the correlation between atoms j and i; on average, the fluctuations of atom j drive the fluctuations of atom i. On the contrary, negative values of Dj→i (in blue) indicate that atom j is the sink of the correlations between atoms j and i, and atom j responds to the motion of atom i.
