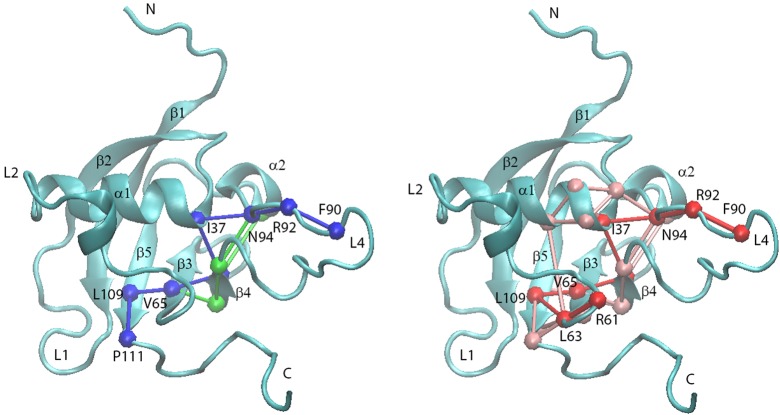
Figure 12.
Plexin-B1 RBD monomer network pathways predicted. (left) only network pathway 1 is shown, in green, which is mostly overlapped by the shortest path shown in blue; (right) network pathway 1, in green, network pathway 2, in pink, and its shortest path, shown in red, with network pathway 1 being totally overlapped by network pathway 2 (again green, not seen). The RBD backbone is shown in cyan, and the residue numbers are labeled in the shortest pathways.

